Gartner puts AI-ready organisations at 43%; McKinsey’s State of AI survey found 88% using AI but two-thirds still stuck in pilot mode. In real estate specifically (my sector), JLL’s 2025 technology survey found more than 60% of firms remain unprepared strategically, organisationally and technically. The immediate advice is often: “get your data house in order”.
Three layers

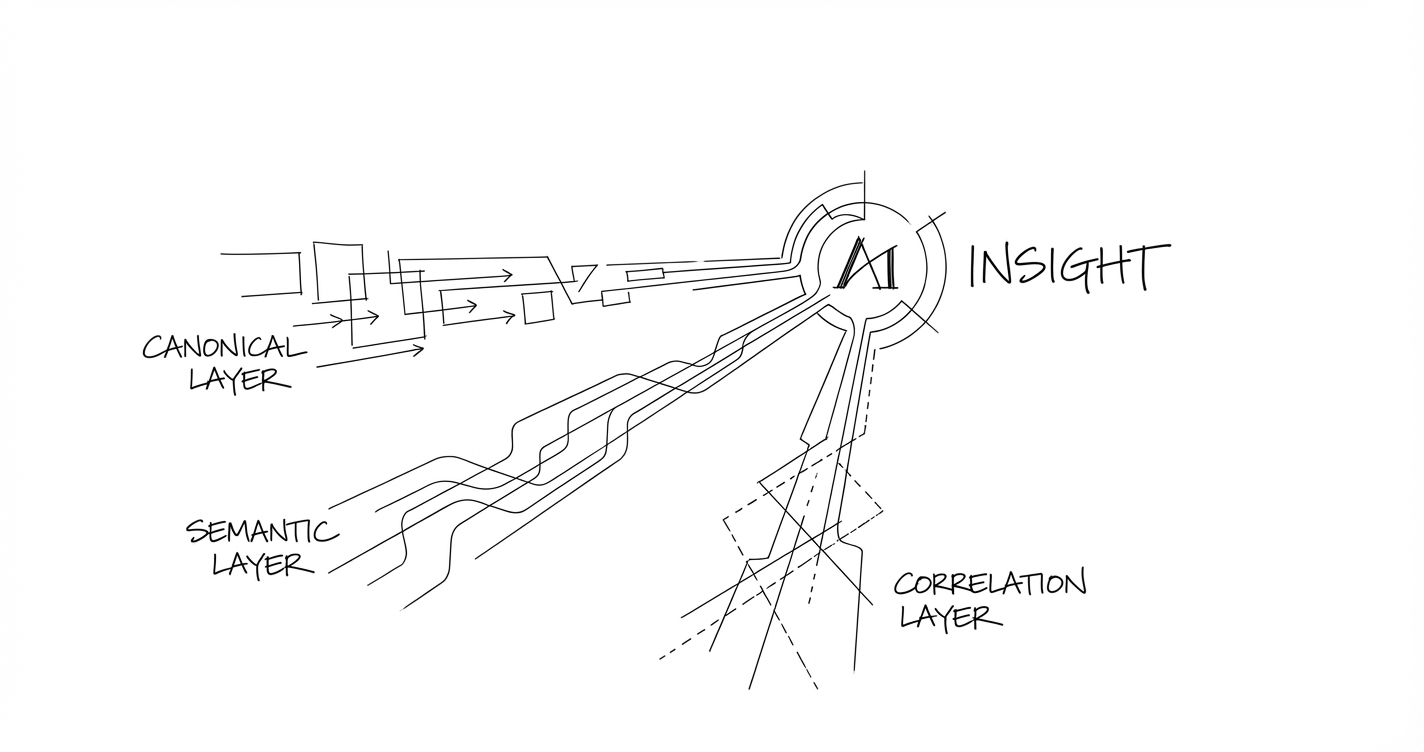
We find it helpful to think about data readiness for AI in three layers: canonical data, semantic layer and correlation data. Each serves a different purpose. The canonical tells you what is, the semantic suggests why it is, the correlation data tells you whether it is you or the market.
Canonical Data
Canonical data is the structured, pre-calculated, agreed-upon metrics. Revenue. Occupancy. Conversion rates. Whatever the core numbers are that your business argues about in meetings.

The key word is pre-calculated. You do not want a language model writing SQL on the fly to answer “what’s our occupancy rate?” You’ll get a slightly different answer every time, depending on how the model interprets the question, which filters it applies, how it handles edge cases. That’s a recipe for eroding trust in the system.
Canonical metrics should be boring. Computed once, stored, versioned, and treated as the source of truth. The AI’s job is to retrieve them, not to derive them.
Semantic Layer
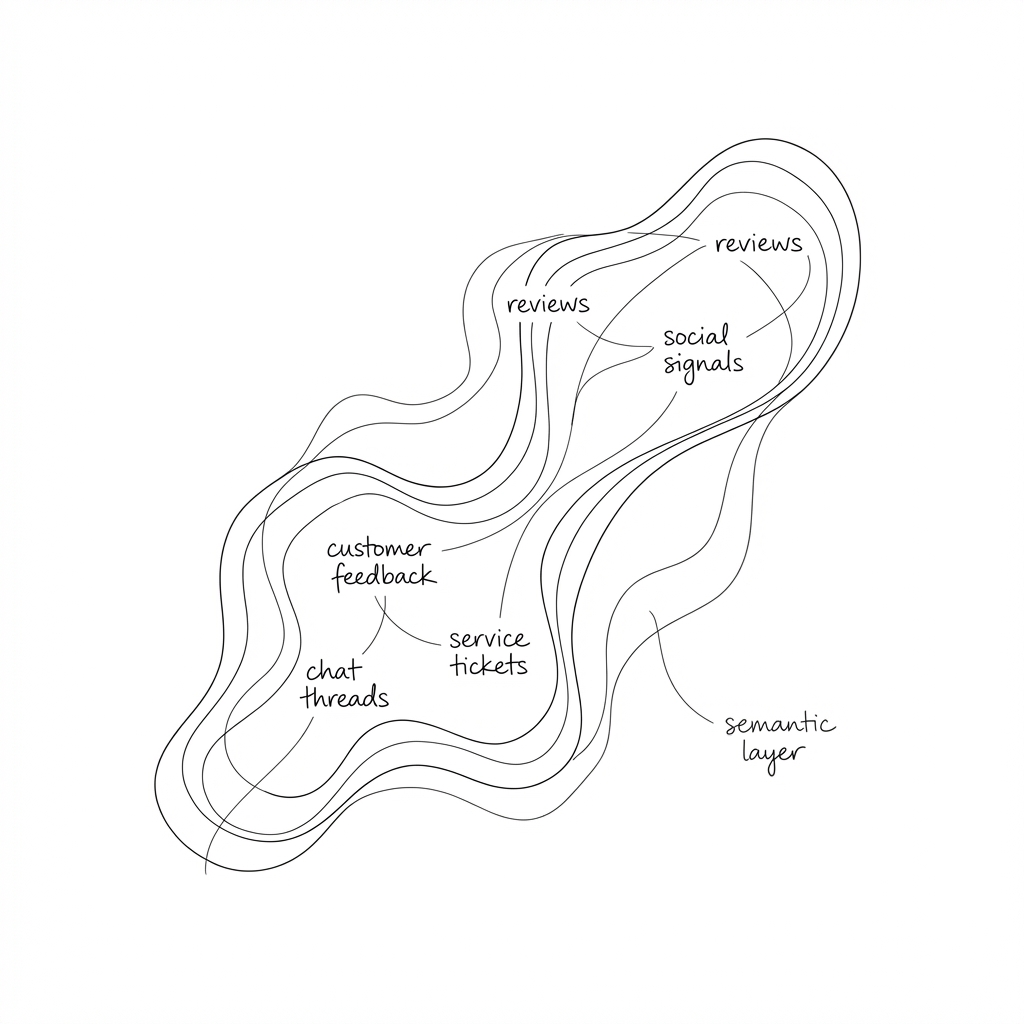
Semantic data is the unstructured stuff. Reviews, feedback, survey responses, support tickets, free-text fields that have been accumulating in databases for years, largely ignored because they don’t fit neatly into reports.
The instinct with unstructured data is often to structure it. Build taxonomies. Create categories. Force the mess into rows and columns so it can be queried like everything else.
This is the wrong move for AI readiness.
The value of language models is that they can reason over fuzzy data without requiring it to be pre-categorised. A review that mentions “the kitchen was disgusting and the landlord took three weeks to respond” contains signal about cleanliness, responsiveness, and sentiment. You don’t need to tag it with those labels in advance. You can embed the text, store the embedding, and let the model find patterns across thousands of similar comments.
Keeping semantic data fuzzy isn’t laziness. It’s a deliberate architectural choice that preserves information rather than discarding it into crude buckets.
Correlation data
Correlation data is the mapping layer. It connects your internal data to external context.

Which properties serve which university catchments? How does your pricing compare to local competitors? What’s the demand signal from the broader market, and how does it relate to your specific assets?
This layer is often missing entirely, or maintained informally in spreadsheets and tribal knowledge. But it’s where a lot of the analytical leverage comes from. Canonical data tells you what’s happening inside your business. Semantic data tells you what people are saying. Correlation data tells you what it means in context.
Where the insight lives

None of these layers is insightful in isolation.
Canonical data alone gives you dashboards. You can see that occupancy is down 6% at a particular property, but not why, and not what to do about it.
Semantic data alone gives you anecdotes. You can read reviews and get a feeling for sentiment, but you can’t quantify impact or prioritise action.
Correlation data alone gives you market research. Interesting, perhaps, but disconnected from your actual performance.
The value emerges when you connect them. Occupancy is down 6% (canonical). Reviews consistently mention cleanliness issues in common areas (semantic). Competitor properties in the same catchment aren’t seeing the same drop (correlation). Now you have something actionable: a specific problem, a likely cause, and a quantifiable gap.
This is what I mean by decision-first queries. Instead of asking “show me the data,” you can ask “where should I invest in facility improvements?” The system assembles evidence from all three layers. You make the judgment call.
The semantic layer gets mishandled
Structured data has decades of tooling and organisational muscle behind it. Correlation data is at least recognised as important. But semantic data falls into a gap. Too unstructured for traditional analytics, it gets either ignored or forced into taxonomies that strip out its value. “The kitchen was disgusting and the landlord took three weeks to respond” becomes category: cleanliness, sentiment: negative. The connection between cleanliness and responsiveness is gone.
Embedding-based approaches change this. The full text can be preserved, vectorised, and made queryable without losing fidelity. “What are residents saying about maintenance response times?” surfaces relevant passages across thousands of reviews without manual tagging.
A practical starting point
Three questions worth starting with:
What are your canonical metrics, and are they pre-calculated? If your core KPIs are being derived on the fly by different tools with slightly different logic, fix that first. AI can’t give consistent answers if the underlying numbers aren’t consistent.
What unstructured data are you sitting on, and what are you doing with it? If the answer is “not much,” that’s probably your biggest opportunity. Customer feedback, support interactions, free-text survey responses. These contain signal that structured data misses entirely.
What external context matters for your business, and is it connected to your internal data? Market data is only useful if you can relate it to your specific situation. Catchment mapping, competitor benchmarking, demand signals tied to your assets.
None of this is glamorous. It’s prep work. Mise en place.
But without it, the AI tools you’re investing in will underperform, and you’ll wonder why the demo looked so much better than the reality.