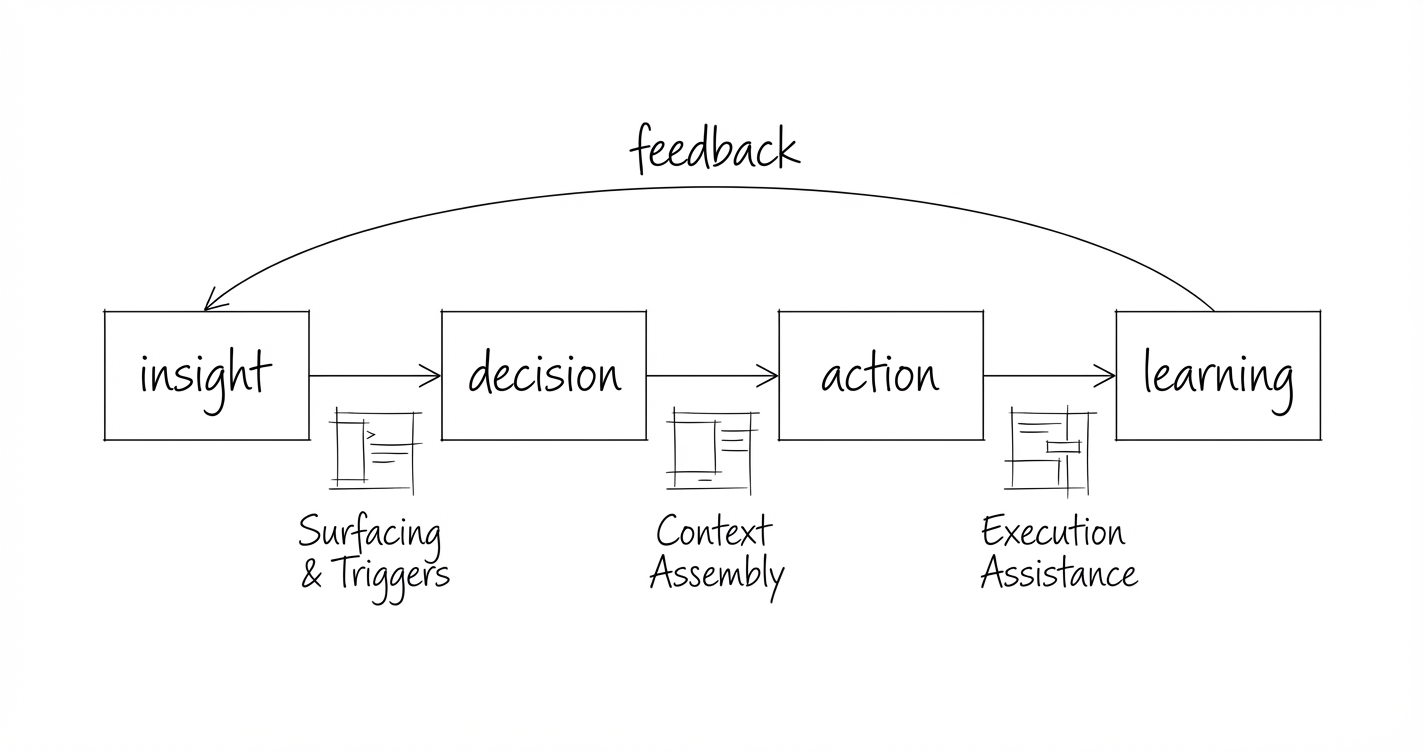
Question-first, not data-first
A dashboard starts with data and asks: “What do you want to see?”
A decision system starts with a question and asks: “What decision are you trying to make?”
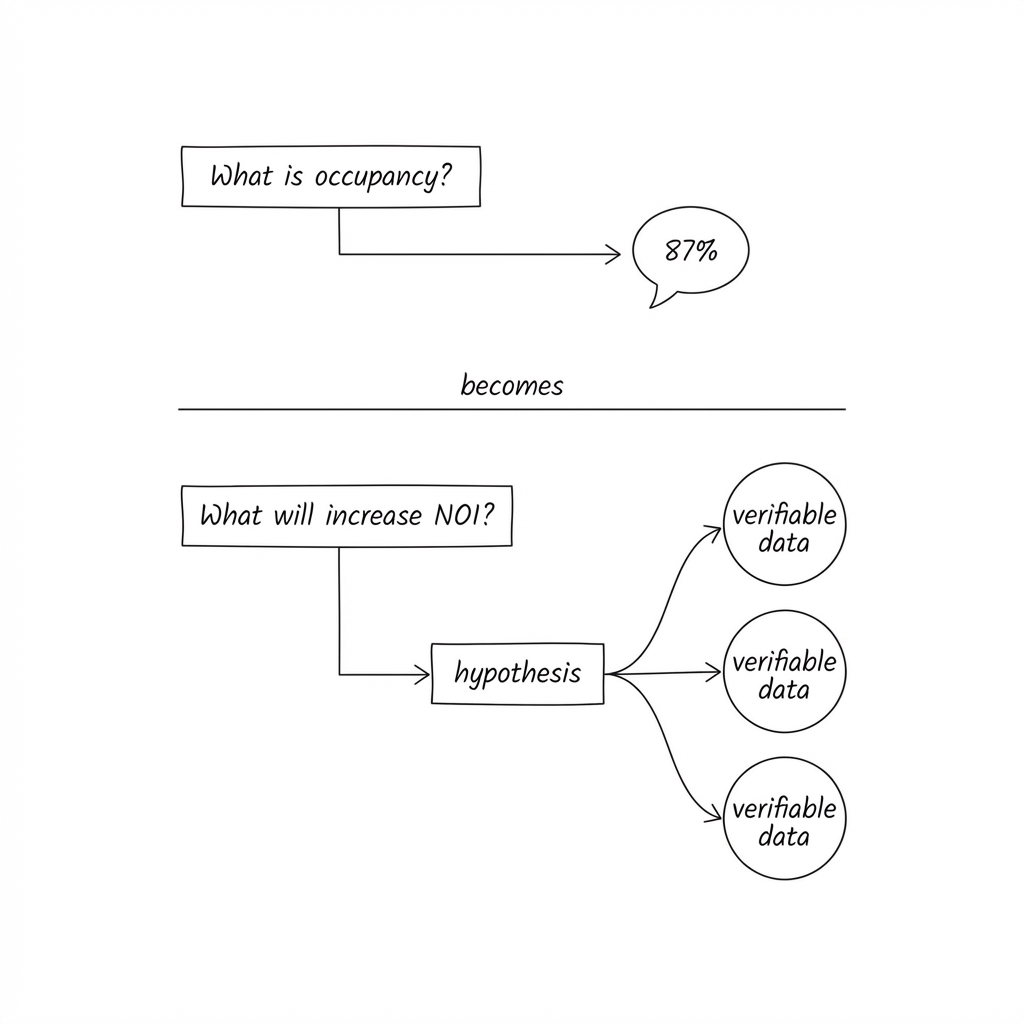
When you ask a dashboard “what’s our occupancy?”, you get a number. You then have to figure out what that number means and what to do about it.
When you ask a decision system “where should I be more aggressive on pricing?”, you get a recommendation with evidence. The system has already done the synthesis work:
- combined booking pace with demand signals,
- checked competitor movements,
- considered your review trajectory, and
- identified where you have headroom.
The output isn’t a number. It’s a judgment-ready brief. Not outsourcing judgment to a model. Supporting judgment with a reasonable argument.
The anatomy of a decision-first query
Every decision-first question follows a pattern. It starts with an action and a scope:
- “Where should I invest in facility improvements?”
- “Which assets are we at risk of underperforming this year?”
- “What would need to be true to hit our occupancy target?”
- “Where is service quality hurting commercial performance?”
These aren’t report requests. They’re the questions that currently require a senior person to assemble context from multiple sources and weigh trade-offs.
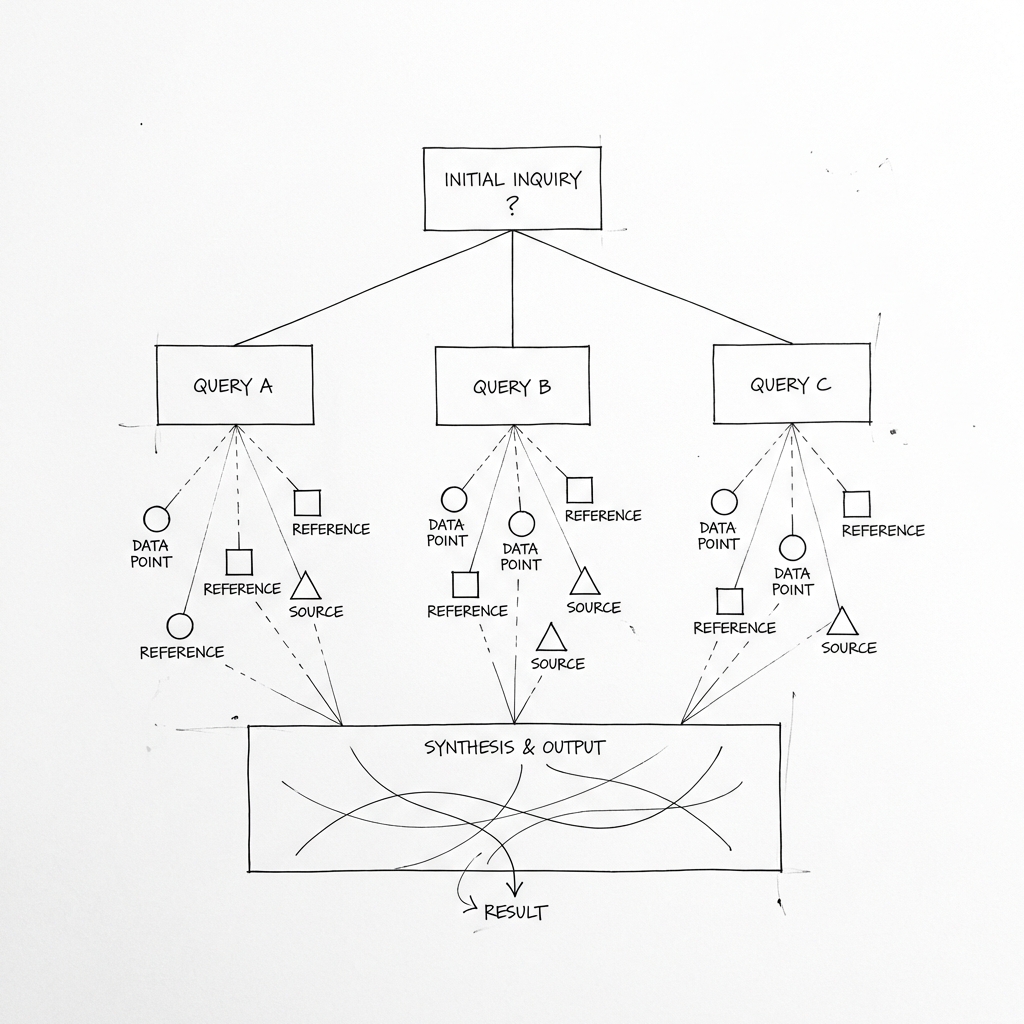
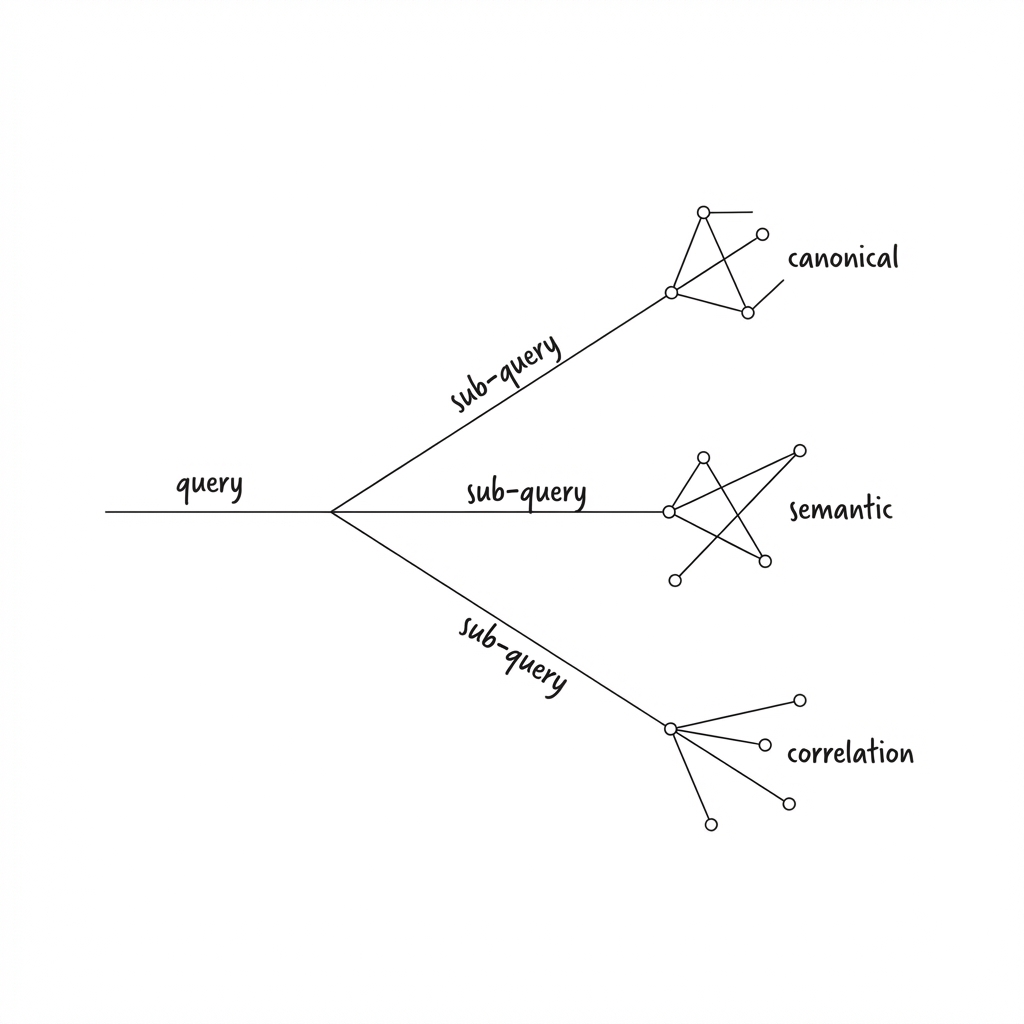
A decision system decomposes each question into evidence requirements. Take “where should I invest in facility improvements?”
The system breaks this into sub-queries:
- Which properties have the biggest gap between your review scores and competitors?
- Where is pricing headroom being capped by perception issues?
- What themes appear in negative feedback?
- Which improvements have historically driven rent increases in similar properties?
Each sub-query pulls from a different part of your data architecture. Structured metrics. Unstructured feedback. Market correlation data. The system then synthesises across all of it.
The output might be: “Building X has cleanliness scores 1.2 points below market, correlating with a 6% occupancy gap worth approximately £180k annually. Competitor properties that addressed common area cleanliness saw average review improvements of 0.8 points within two cycles.”
That’s decision support.
What changed
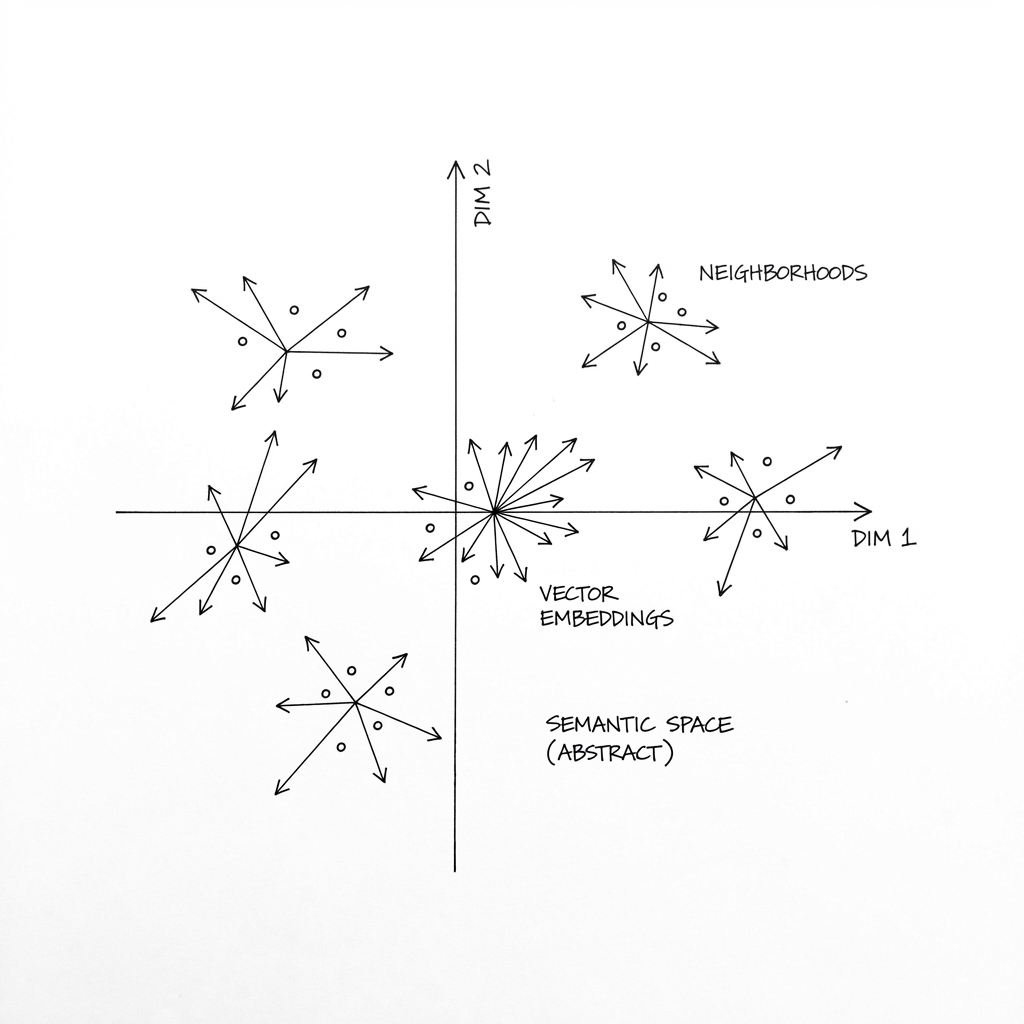
Two things make decision systems viable now. Language models can combine multiple pieces of information, reason across them, and produce coherent recommendations. The synthesis work that used to require a skilled analyst can be partially automated. And embedding models make unstructured data queryable. Reviews, feedback, support tickets, free-text survey responses that sat in databases doing nothing can now be searched semantically and included in synthesis alongside structured metrics.
These capabilities only work if the underlying data architecture supports them. Point a language model at messy, inconsistent data and you’ll get confident-sounding nonsense.
This is why data readiness matters. You need canonical metrics that are pre-calculated and trustworthy. You need semantic data that’s embedded and searchable. You need correlation mappings that connect your internal data to external context.
The AI is the reasoning layer. It needs a foundation to reason over.
Building blocks
If you’re thinking about building something like this, here’s how I’d structure it.
Natural language decomposition. The user’s question has to be parsed into sub-queries that map to your data structure. This is where an LLM interprets intent and breaks it into evidence requirements.
Reliable structured retrieval. Canonical metrics should return fast and consistent. You don’t want the system writing complex SQL on the fly for core KPIs. Pre-calculate them. Version them. Treat them as the source of truth.
Semantic search over unstructured data. Embeddings, vector databases, similarity search. When the question requires understanding “what people are saying about X”, the system needs to surface relevant passages from thousands of documents without manual tagging.
Correlation mappings. Which properties serve which markets? What external signals are relevant to which assets? The system needs to traverse these relationships to add context.
Synthesis layer. This is where the LLM combines everything and produces the output. The key is giving it structured inputs from the previous layers, not asking it to figure everything out from raw data.
The confidence problem

One risk with decision systems is false confidence. A well-constructed sentence with numbers in it can feel authoritative even when the underlying evidence is thin.
Good decision systems make evidence quality visible. They show sources. They flag data freshness. They express uncertainty when it exists.
“Based on 2024 review data and current booking pace, with moderate confidence…” is more honest than a clean recommendation with no caveats.
This is a design choice. The interface can either hide uncertainty behind polish or surface it clearly. The second approach builds more trust over time.
Humans still decide

Decision systems replace the manual synthesis work that bottlenecks on key people. The analyst spending two days pulling data for a quarterly review. The spreadsheet that triangulates three reports. The meeting where everyone argues about what the numbers mean.
They don’t replace judgment. The system can tell you that Building X has a cleanliness problem worth £180k. It can’t tell you whether fixing it fits your capital allocation strategy this year, or whether you’re planning to sell that asset anyway. Decision systems compress the time between “I need to make a decision” and “I have what I need to make it well.”
The shift
Dashboards were the right answer when the hard problem was visibility. The hard problem now is synthesis. Decision systems start with your question, not your tables. They interpret and show you what they found, rather than showing you data and asking you to interpret it.
The organisations that build this capability will make better decisions, faster, with less dependence on heroic individuals.
This is part of a series on AI supported decision-making. See also: AI Data Readiness and When Decisions Stop Scaling.